April 10, 2023
This Time It’s Different, or Is It?

“The investor who says, ‘This time is different,’ when in fact it’s virtually a repeat of an earlier situation, has uttered among the four most costly words in the annals of investing.” – Sir John Templeton’s 16 Rules for Investment Success (1933)
As investors, we are all emotionally vested. Our financial goals, our dreams and our future rely heavily on investing and our investments. Many influences – talking heads on TV, Twitter, friends, family and even our own “gut feeling” – play into these emotions, and while we do our best to avoid or perhaps explain the noise all around us, we must admit the difficulty in simply ignoring it all.
Realistically, we can’t just put our heads in the sand and hope for the best. That means we must also assume the task of deciphering what is solely opinion (i.e., noise) and what is actual, evidence-based information.
Unfortunately, it’s human nature to act or react on bad financial news, thinking that we have to do something. When we feel that things are going well, we naturally are more comfortable and more willing to accept certain risk. Consider the following.1
- Since 1928 the S&P 500 has had 26 bear markets.
- Since 1928 the S&P 500 has had 27 bull markets.
- Average stock losses during a bear market are 36%.
- Average stock gains during a bull market are 112%.
Indices are not available for direct investment. Their performance does not reflect the expenses associated with the management of an actual portfolio nor do indices represent results of actual trading.
“You get recessions, you have stock market declines. If you don’t understand that’s going to happen, then you’re not ready, you won’t do well in the markets.” — Peter Lynch
Knowing this data should make us pause in how we think about bear markets and what actions (or non-actions) we should take in response to them. Being able to stomach risk, and subsequent bear markets, is the only way to benefit from what we know bull markets will provide. It’s time in the market, not the timing of markets, that provides the greatest chance of achieving your financial goals. Yet, in periods of uncertainty (declining or volatile markets), people tend to buy and sell more frequently, hurting what we know to be the upside potential.
A well-known study on American pension fund returns showed that, on average, nearly 94% of the variation of returns over time was explained by the investment policy decision.2 In layperson’s terms, this means that most of a portfolio’s return can be explained by the asset allocation decisions you make, not by timing when to buy or sell or even security selection.
When reviewing market history and overlaying it with history in general, we can observe many instances where it seems to repeat itself. But we also tend to ignore or fail to recognize those occurrences. In fact, market history, presidential history, and world events are often more intertwined than we realize. When we think, “This time it’s different,” we must look at history more comprehensively to ensure that it truly is. To that end, examining three commonalities that investors have faced going back decades should put to rest any doubt about whether this time really is any different. They are: 1) presidents and the impact their terms have on stock markets, 2) the lure of the next hot stock or sector, and 3) country-specific and/or worldwide events. Let’s explore each in turn.
Presidents and their impact on stock markets
We reviewed data going back to 1952 and Dwight Eisenhower’s first term for a look at stock returns between a president’s election and inauguration, and then the annualized return during a president’s term. The purpose was to see if there was a correlation between political party and any discernible difference pre- and post-inauguration (that is, post-election but prior to inauguration).
Annualized Returns During U.S. Presidential Terms
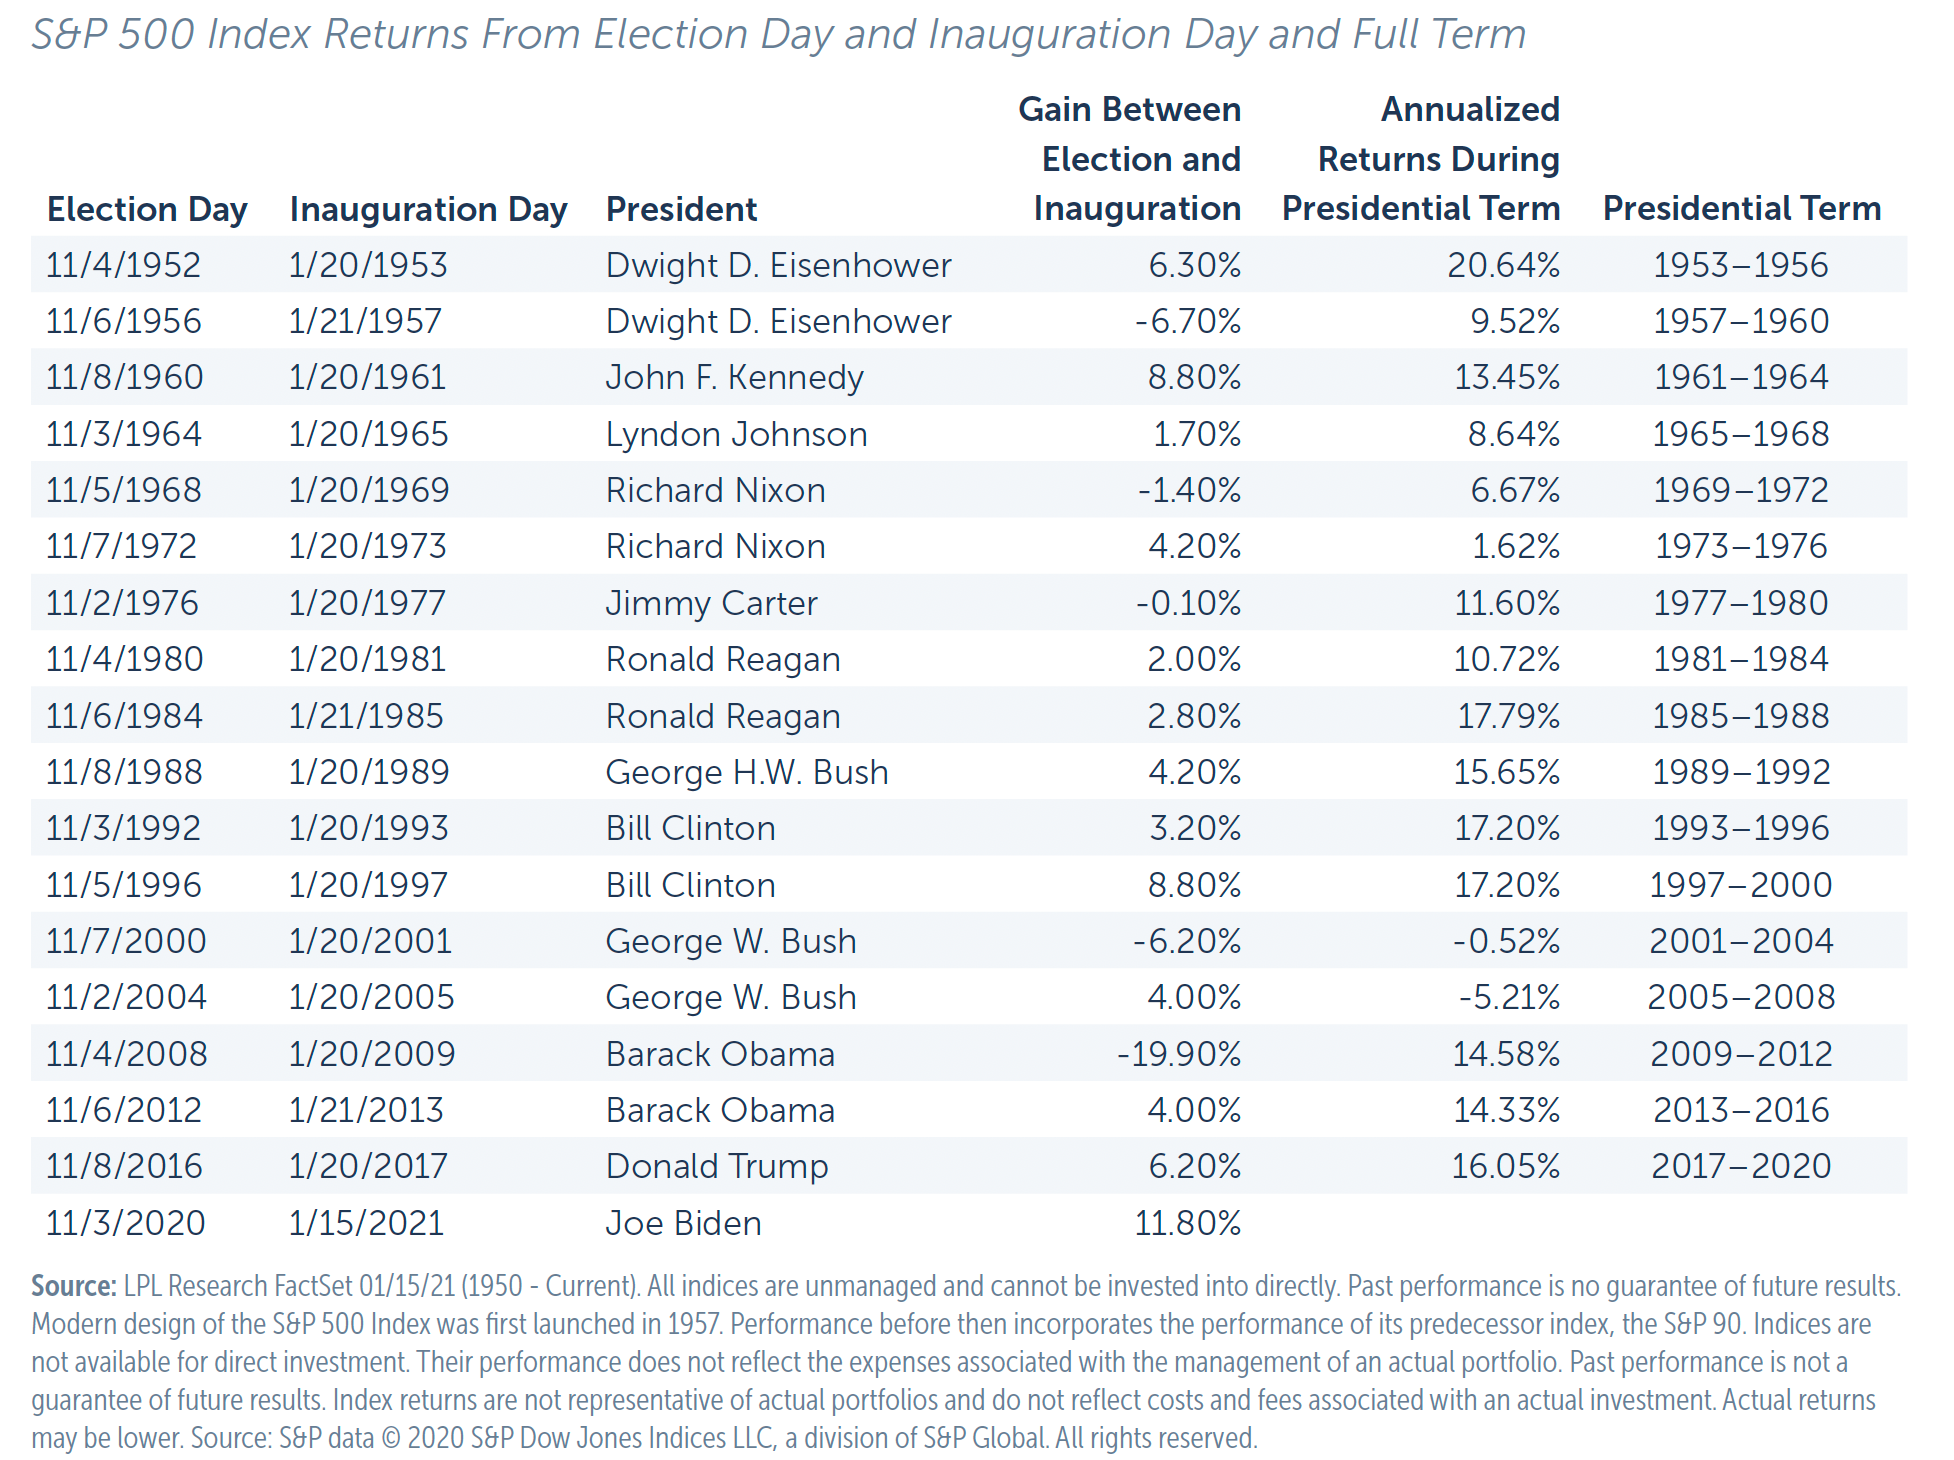
Per the data:
- Five presidents-elect (three Republicans and two Democrats) had negative returns
following the election but before the inauguration. - Two presidential terms (both Republican) had negative returns.
This is not meant as an indictment of any party or president. What the data tells us is that it doesn’t matter who the president-elect will be. We can write another article on good or bad presidents or good or bad policies, but as it relates to markets the evidence is very clear. You should not make investment decisions based on who you think the president-elect will be or becomes. In fact, the evidence backs up the time-in-the-market-versus-timing-the-market studies, meaning the most prudent course of action is to keep working your financial life plan through political cycles as well as the market’s ups and downs.
A History of Market Ups and Downs & Presidential Term Returns
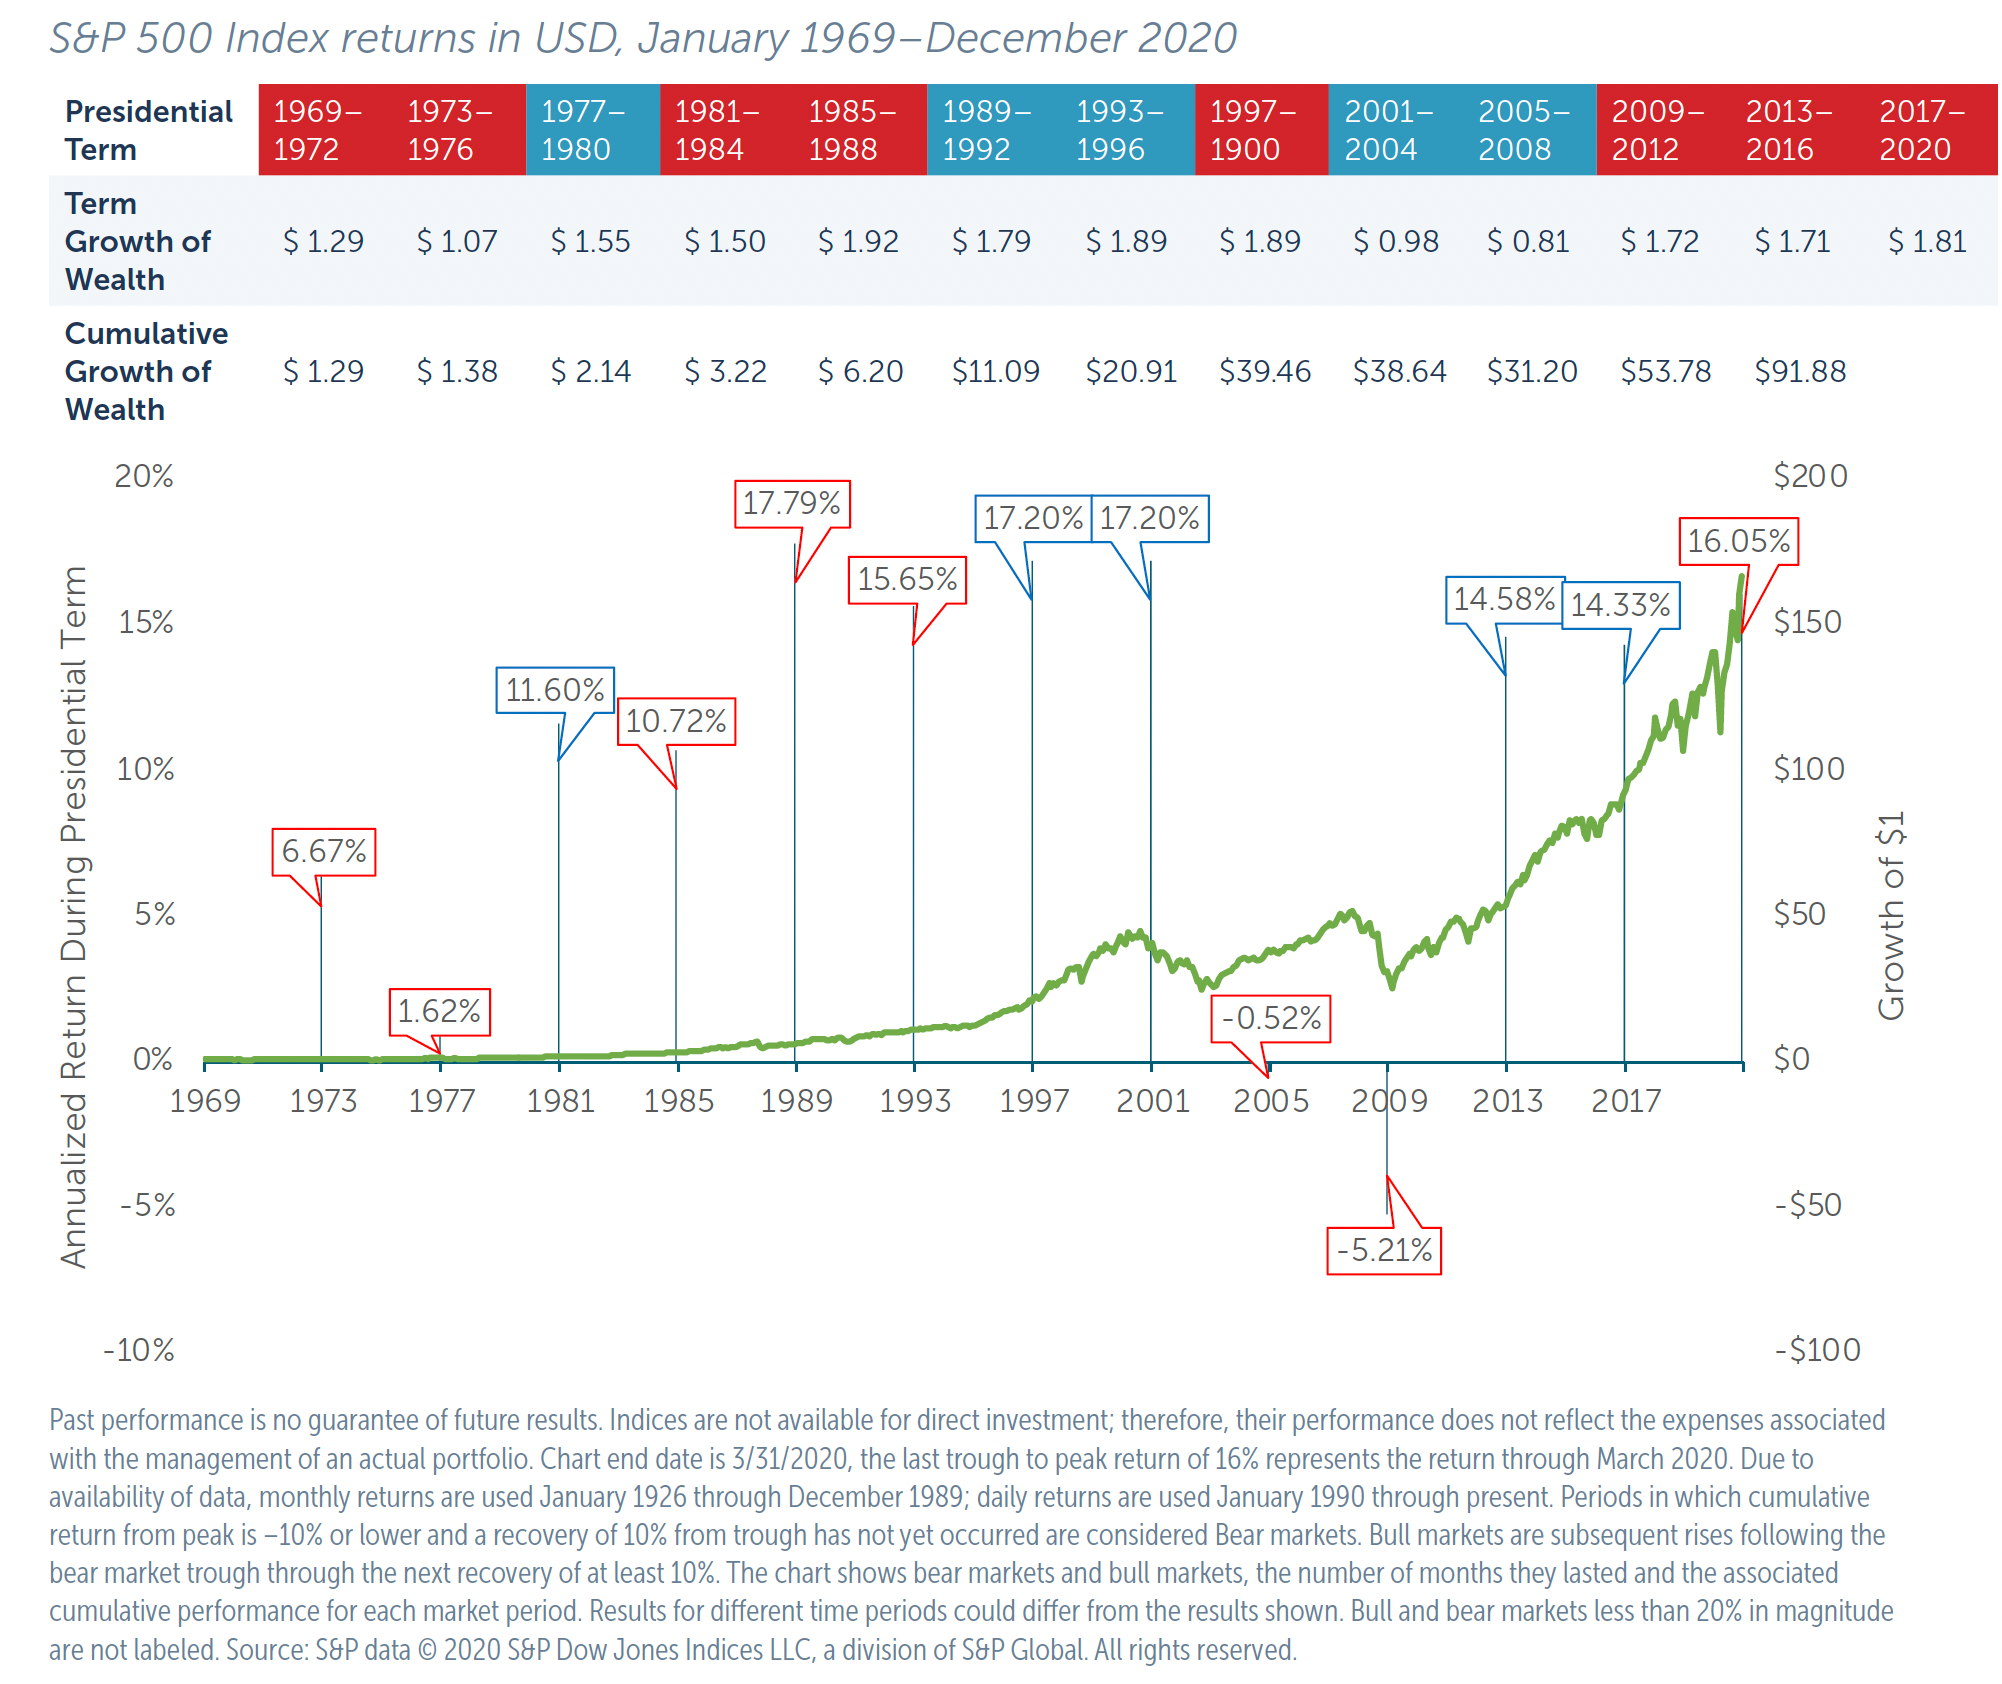
By studying the growth of a hypothetical $1 invested in equity markets, you can see that most presidents grew its value over their term. The cumulative impact, though, is why we should remain invested for the long term, because $1 hypothetically invested in 1969 grew to $166.66 by 2020 – an increase of 16% annualized, which means it grew by that amount on average each year over the period.
Resist the lure of the next “hot” stock or sector
As mentioned above, the vast majority of portfolio returns are determined by asset allocation. The following chart shows returns from 2000-2020. Each color represents an asset class shown from best to worst performance in that particular year. An asset class is a group of investments that have similar characteristics. This basket of stocks attempts to replicate a benchmark asset class, such as large-cap stocks (S&P 500) or international stocks (MSCI EAFE).
The Randomness of Returns
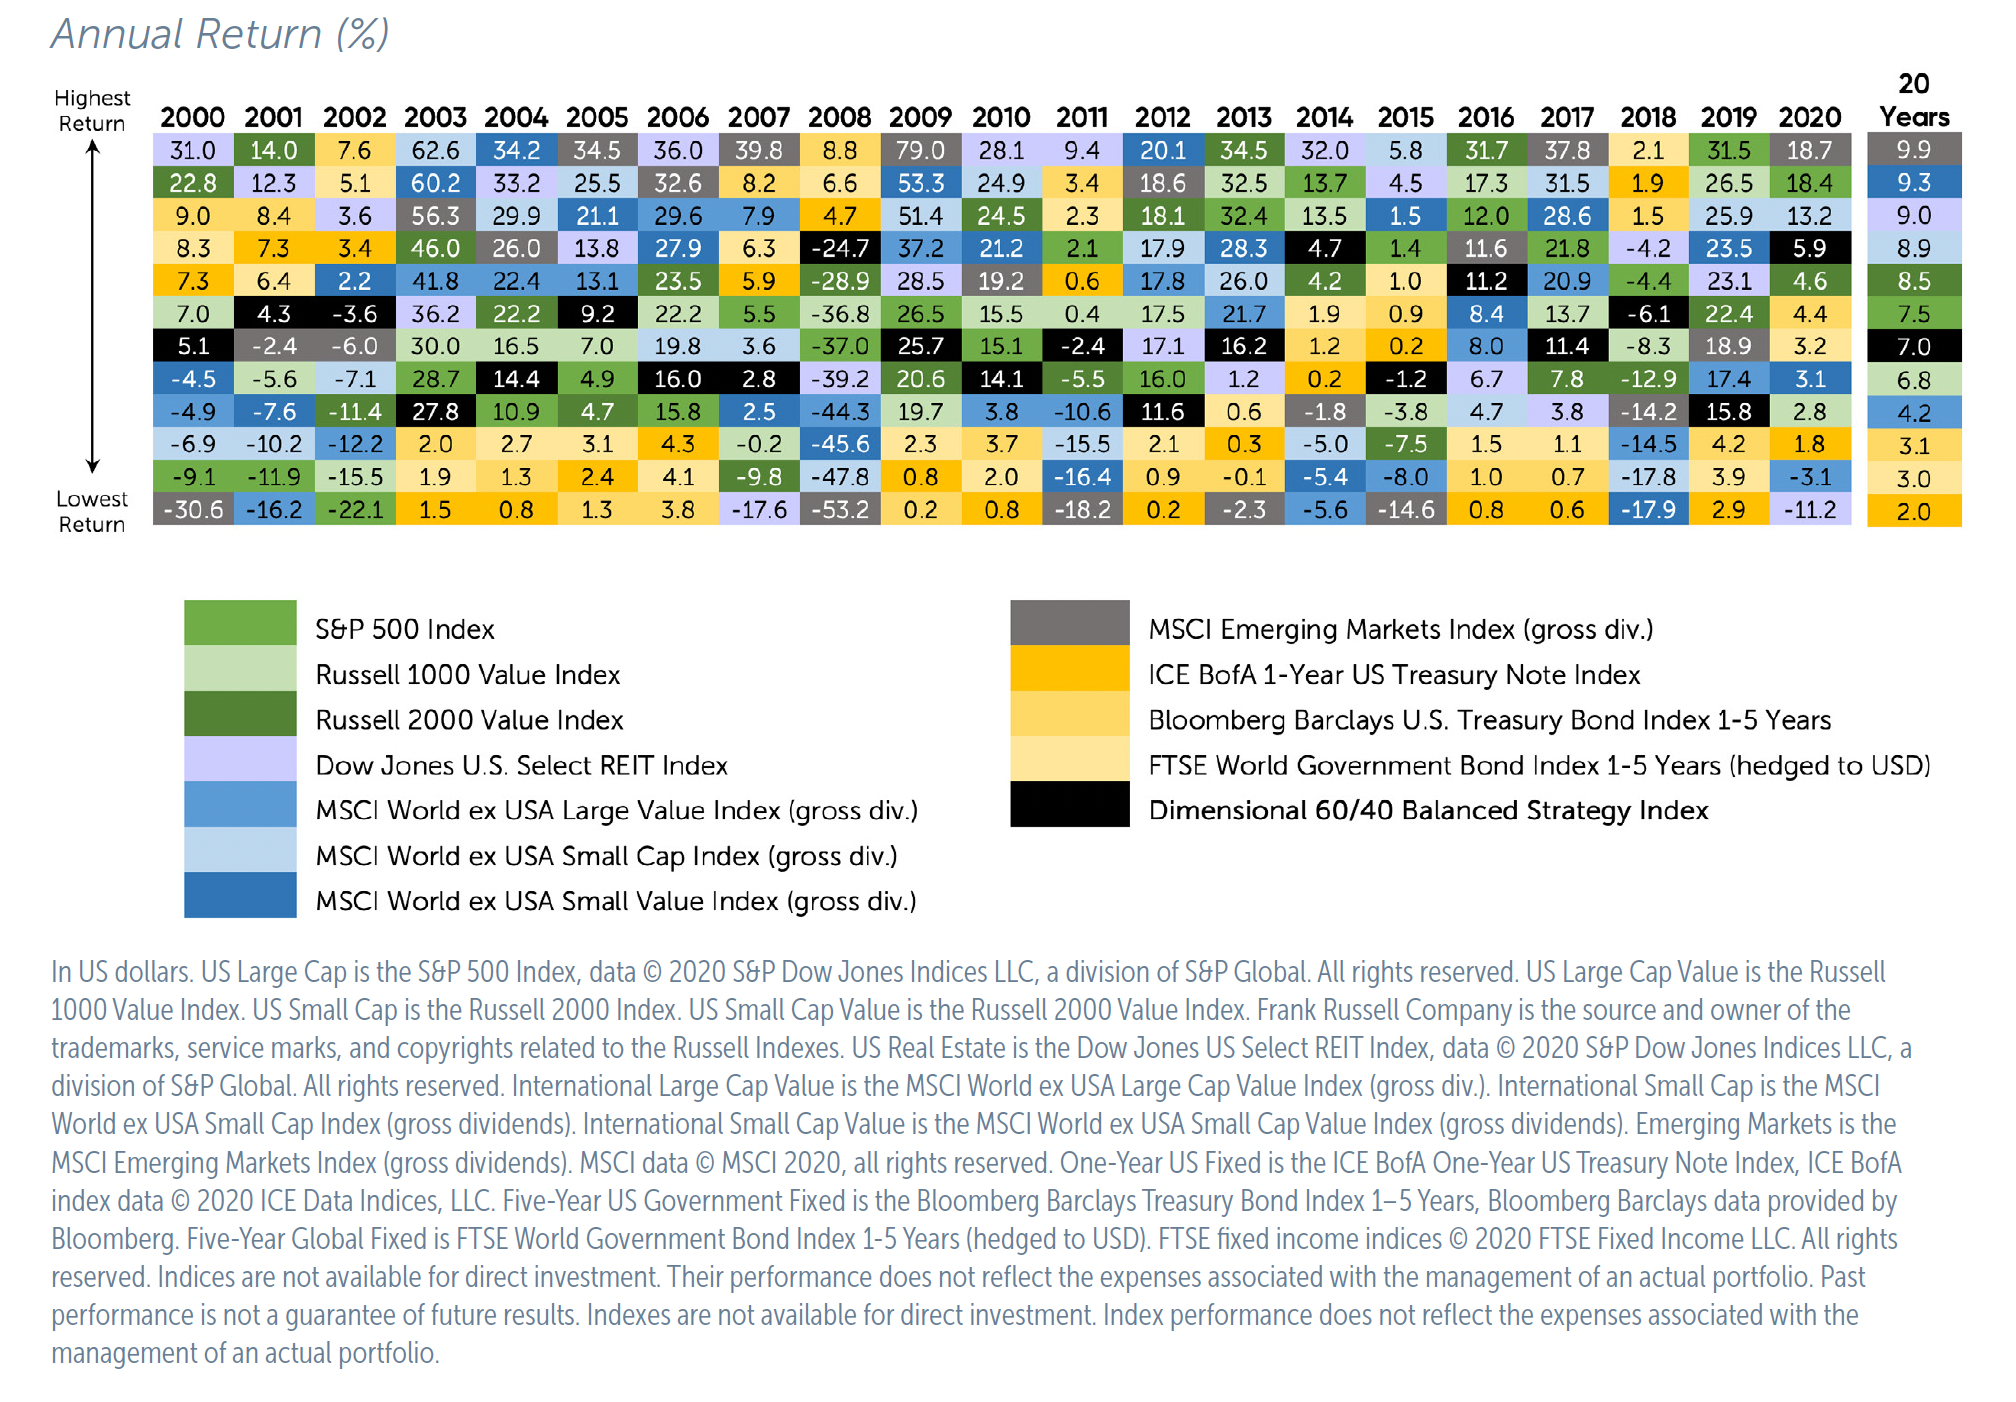
There are two rhetorical questions to ask yourself:
- Which asset class will be best next year?
- Am I willing to not only select an asset class but put all of my money into it?
If you follow the black box on the chart, you will see the benefit that prudently and globally allocated investments provide. While there may be years that an asset class does better and other years that it will do worse, we eliminate the risk of selecting, ahead of time, what we think the answer is. (That kind of selecting is active management, which persistently fails to outperform.3) Being wrong can be catastrophic for a long-term investor. As John Bogle once said, “Don’t look for the needle in the haystack. Just buy the haystack!”
Weathering country-specific and/or worldwide events
Within every presidency, there are without a doubt major country-specific and/or worldwide conflicts and situations that arise. Many this-time-it’s-different moments revolve around these major (sometimes devastating) events, such as oil embargoes, inflation, war, the dot-com crash, 9/11, the Great Recession, the pandemic, Brexit and more. If you study market returns from the 1970s, you will see that the stock market moved at a steady uptrend with temporary declines. In fact, if you had invested a hypothetical $1 in the S&P 500 in 1970, it would have hypothetically grown to $154 by the end of 2020, despite the many less-than-ideal market and world events we all have lived through. What’s more, a dollar hypothetically invested in a diversified portfolio, as defined in the following chart, would have hypothetically grown to $510 over the same period.
A History of Market Ups and Downs & Growth of Wealth
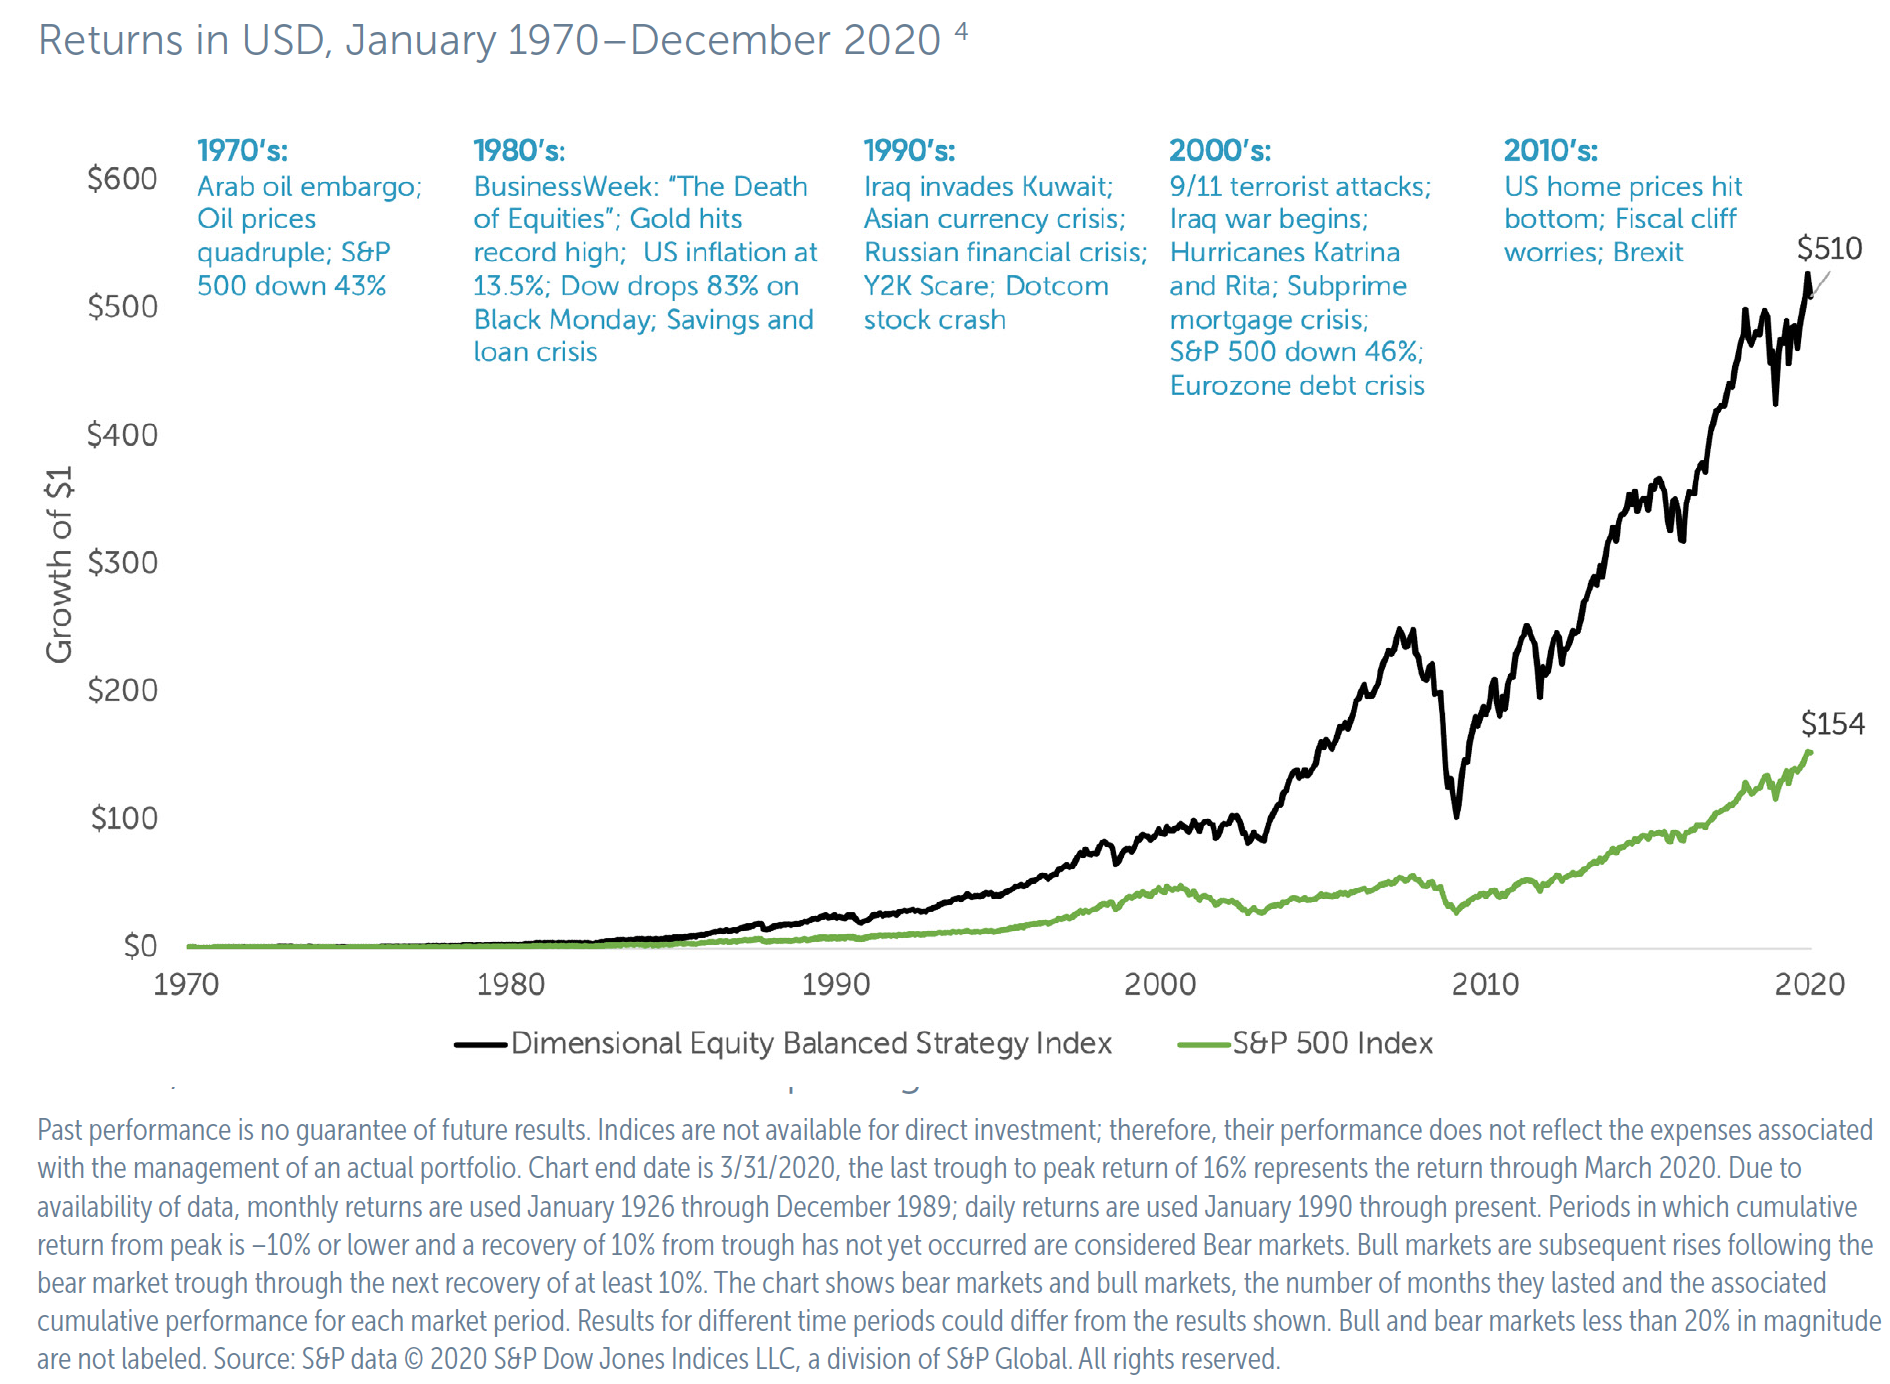
In the moment, such events are very real and very scary. And this is not to say that you should turn a blind eye and ignore what is happening in the world markets. But it does indicate that, if you have a long enough timeframe, the historical evidence suggests that markets will recover. And if you are taking an appropriate amount of risk based on your willingness, ability and need to do so, you will give yourself the best odds of being in a position to take advantage of it. Additionally, the recovery is often quite quick and many times without warning.
Consider the Great Recession. According to the National Bureau of Economic Research, the official arbiter of U.S. recessions, the market bottom was March 2009 and the recession technically didn’t end until June 2009. That being the case, the formal and official announcement of the end of the recession didn’t occur until September 2010. From March 6, 2009, through Sept. 10, 2010, the S&P 500 returned 62%.5 If we had waited for the “all clear” before returning to the market, we would have missed a 62% upswing in the S&P 500.
The same is true with the 2020 pandemic. The market bottom was March 20, 2020, well before we had vaccines and even a glimpse of an open economy. By the first part of 2021, the S&P 500 had risen 86% without an all clear that the pandemic was over and without world economies having fully reopened.6
There is no doubt that presidential policy and world events do have direct impact on countries, stocks and sectors, and even the fixed income markets. This we know. What we don’t know is how the impact will be felt, where this impact helps or hurts most, and most importantly when such events will occur. When you feel unease over tumultuous world events, the culprit could well be that your asset allocation and risk tolerance aren’t properly aligned more than there’s anything really all that different going on. The correct mix of stocks and bonds, domestic and international equities, and when and where to include alternative asset classes all play into proper asset allocation.
The next time something serious happens in the world – a presidential election or a world or country-specific event – or the next time you hear about the next “hot” stock or sector, consider the evidence, all of the evidence.
Throughout the last 100 years, it’s amazing that the more things change the more they seem to stay the same. This also holds true for investing and markets. Diversify. Stay the course. Build a portfolio based on the risk you can handle, because selling at the wrong time can destroy an entire financial life plan.
“The investor’s chief problem – even his worst enemy — is likely to be himself.” — Benjamin Graham
For informational and educational purposes only and should not be construed as specific investment, accounting, legal, or tax advice. Certain information is based upon third-party data which is deemed to be reliable, but its accuracy and completeness cannot be guaranteed. Third-party data may become outdated or otherwise superseded without notice. Indices are not available for direct investment. Their performance does not reflect the expenses associated with the management of an actual portfolio nor do indices represent results of actual trading. Information from sources deemed reliable, but its accuracy cannot be guaranteed. Performance is historical and does not guarantee future results. Total return includes reinvestment of dividends and capital gains. By clicking on any of the links above, you acknowledge that they are solely for your convenience, and do not necessarily imply any affiliations, sponsorships, endorsements, or representations whatsoever by us regarding third-party websites. We are not responsible for the content, availability or privacy policies of these sites, and shall not be responsible or liable for any information, opinions, advice, products, or services available on or through them. The opinions expressed by featured authors are their own and may not accurately reflect those of Buckingham Strategic Wealth®. Neither the Securities and Exchange Commission (SEC) nor any other federal or state agency have approved, determined the accuracy or adequacy of this information. R-21-2572
- “10 Things You Should Know About Bear Markets,” Hartford Funds, https://www.hartfordfunds.com/...
- “Determinants of Portfolio Performance” (Financial Analysts Journal, 1986) Conducted by Gary P. Brinson, L. Randolph Hood, and Gilbert L. Beebower.
- S&P Dow Jones Indices SPIVA Scorecard results, https://www.spglobal.com/spdji...
- Dimensional Equity Balanced Strategy Index description: Rebalanced monthly. The Dimensional Equity Balanced Strategy Index is comprised of commercial and Dimensional indices, 70% US equity indices, and 30% non-US indices. US: S&P 500, large cap value, small cap, small cap value, Dow Jones REIT; non-US: international value, international small cap and small cap value, emerging markets, and emerging markets value and small cap. Real Estate Strategy weighting allocated evenly between US Small Cap and US Small Cap Value prior to January 1978 data inception. International Value weighting allocated to Fama/French International Value Index prior to January 1994 data inception, and evenly between International Small Cap and MSCI EAFE Index (net dividends) prior to January 1975 data inception. International Small Cap Value weighting allocated to International Small Cap prior to July 1981 data inception. Emerging Markets weighting allocated to MSCI Emerging Markets Index (gross dividends) prior to January 1994 data inception, and evenly between International Small Cap and International Value prior to January 1988 data inception. Emerging Markets Value and Small Cap weighting allocated evenly between International Small Cap and International Value prior to January 1989 data inception. Two- Year Global weighting allocated to One-Year prior to January 1985 data inception. For illustrative purposes only. The balanced strategies are not recommendations for an actual allocation. Indices are not available for direct investment; their performance does not reflect the expenses associated with the management of an actual portfolio.Rebalanced monthly. All performance results of the balanced strategies are based on performance of indices with model/back-tested asset allocations; the performance was achieved with the benefit of hindsight; it does not represent actual investment strategies. The model’s performance does not reflect advisory fees or other expenses associated with the management of an actual portfolio. There are limitations inherent in model allocations. In particular, model performance may not reflect the impact that economic and market factors may have had on the advisor’s decision making if the advisor were actually managing client money. Past performance is no guarantee of future results. The Dimensional Indices have been retrospectively calculated by Dimensional Fund Advisors LP and did not exist prior to their index inceptions dates. Accordingly, results shown during the periods prior to each Index’s index inception date do not represent actual returns of the Index. Other periods selected may have different results, including losses. Backtested index performance is hypothetical and is provided for informational purposes only to indicate historical performance had the index been calculated over the relevant time periods. Backtested performance results assume the reinvestment of dividends and capital gains. Eugene Fama and Ken French are members of the Board of Directors of the general partner of, and provide consulting services to, Dimensional Fund Advisors LP.
- Returns data from Yahoo Finance
- Returns data from Yahoo Finance
Category
InvestingAbout the Author

Aaron Vickar
Wealth Advisor
Stay Connected With Buckingham
Want more resources like this? Click here to receive financial insights, articles, videos and webinar invitations.